Thursday, March 31, 2016

Ratings Arbitunities — A Tale of 5 Bonds

Moody's, Fitch, S&P and all often get bundled together under the same umbrella as "credit rating agencies," and it's quite possible that we're among those guilty of treating them as if they're all pretty much alike.

Of course, each rating agency is different, and even within each rating agency, arguments can be made that across different departments or product types, their ratings don't exactly mean the same thing.  So, naturally, different rating agencies might well rate things differently.

Moreover, each rating agency has its own (different) ratings scale.  And applying a similar result to different scales can mean that one rating agency's BB may be another's BB+.  Or might the differences be much larger yet?

We've investigated thousands of seasoned RMBS securities, issued pre-crisis, and our findings were ... interesting.  

Below, we're going to show some bonds for which three credit rating agencies have different opinions.  Err, very different opinions.  For some traders and risk-managers, large ratings differentials can create real money-making opportunities, even if it's just by way of risk-allocation or strategic re-allocation benefits. Importantly, in the world of OTC debt instruments, ratings arbitrages don't exactly disappear overnight.  They can exist for ... years.

We hope you enjoy some of the following: current ratings of the same bonds, per 3 different rating agencies.  Screenshots are courtesy of Bloomberg LP.  


Thursday, March 24, 2016

While the Shorts are Getting High on Valeant...

The last ten days have been miserable for shareholders of Valeant (VRX), investors in its debt, or believers in (insurers of, or "sellers of protection" on) its creditworthiness.  

The stock is down >50% over the last ten days.  Accounting statements are said to be unreliable; the CEO and CFO are no longer there, with the CFO having been accused by the company of improper conduct. The list goes on.  Investor Bill Ackman has been recently appointed to the board (arguably a credit positive).

Just about a year ago in March 2015, Valeant raised millions of dollars from debt investors, with ratings of B and B1 being provided to their debt by S&P and Moody's, respectively.

Already denoted as being of somewhat high risk, it was interesting to visit the responses of market participants (traders), and compare them to those of the rating agencies, on receiving the never-ending slew of incoming bad news.

Credit default swap (CDS) spreads widened dramatically on Valeant (reference obligation US91911KAE29) in the last 10 days. See the spike on the right of the following Bloomberg graph. 


At a 40% recovery, CDS-implied default probabilities more than doubled from 5.7% to 13.2% on the 1-year, and cumulative default probabilities jumped from 37.3% to 55.2% on the 5-year trades.

Meanwhile, the rating agencies were less alarmed, and their response more tepid: Moody's downgraded Valeant bonds one rating subcategory from B1 (watch negative) to B2 (watch negative); S&P simply placed the bonds (downgraded to B- from B in October) on downgrade watch.


To put the difference into perspective, we wanted to draw a relationship between the CDS-implied default probabilities and rating agency-implied default probabilities.  

We'll do this for Moody's, by way of their idealized default rate tables.

Valeant Starting to Look Like a Triple C Basket Case

In the 1-year CDS, now at 13.2% from 5.7%, the market is now no longer seeing this as a B1/B2 risk  (close to Moody's rating) as it did on March 14, bur rather closer to a B3/Caa1 credit as of March 24.

The pattern is even more dramatic for the lengthier term 5-year CDS: at the 55.2% CDS-implied cumulative default probability, the market is seeing the credit risk as closer to the Caa2/Caa3 range.


Right now, the market is saying that there's chaos at Valeant.  Moody's and S&P aren't so sure.

Monday, March 21, 2016

Was Information Fed Pre-Fed?

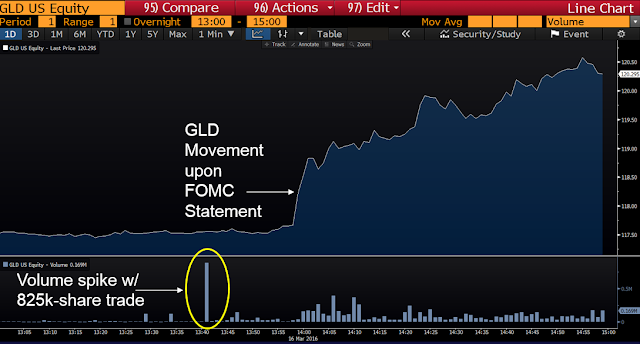
Last Wednesday the Fed concluded its two-day Federal Open Market Committee (FOMC) meeting and issued its statement, deciding to hold the Fed Funds rate between 0.25% and 0.50%, as expected. The accompanying economic projections show that Fed policy-makers currently expect to raise rates only twice this year, down from their December median projection of 4 rate hikes in 2016. Markets responded in kind to the Fed’s more accommodating monetary stance, with 2-year yields falling, the dollar weakening, and gold rallying. 

One of our readers passed along a chart showing an 890,000 share spike in volume in GLD (the SPDR Gold Shares ETF) about 20 minutes before the 2:00 FOMC statement release — a volume spike which doesn’t create any noticeable spike in the market. We dug into Bloomberg’s “Trade/Quote Recap” data and found that there was a single execution of 825,000 shares. 

Source: Bloomberg 

Our reader was suspicious of the timing, suggesting that perhaps the statement and updated projections had been leaked. 

We certainly would not dismiss the possibility of information leakage and the timing of the block trade certainly is curious, but it’s worth being skeptical in this instance: there are plenty of innocent explanations for a block trade in GLD — even one so close to the release of the FOMC statement: 

First up, is a trade of 825,000 shares of GLD all that unusual? According to Bloomberg, and not counting opening and closing crosses, there were 36 trades of 500,000 shares or more (ranging up to 1.8 million shares per trade) in the previous 30 trading days. So while trades of half a million shares or more of GLD are not exactly an hourly occurrence, they do occur slightly more than once per day. 

Next, we cannot ignore the (albeit remote) possibilities that (1) investors (or traders) weren’t targeting the vanilla GLD, as much as delta-hedging a large options position or (2) that the GLD transaction was part of an arbitrage strategy in which a trader bought or sold GLD shares against a short or long position in gold futures. (If we assume a delta of .50 for an at-the-money option, then an 825k share cash position suggests the options position would be around 1.65 million shares, or 16,500 contracts.) 

Finally, we can’t be sure that this trade was initiated by a buyer — there are, of course, two sides to every trade.[1] Perhaps the customer initiating the trade was a seller and the broker-dealer bought the block (or found the other side of the trade) in order to facilitate a customer sell order.  In other words, maybe it was a large seller, looking to get out of a long position before the Fed decision. We have no way of knowing which side of the trade the customer was on, nor whether the broker-dealer took principal risk or found the other side of the trade. (FINRA would, however, be able to dig further, if so inclined, via the OATS system, which enables them to monitor the detailed history and execution of orders.)

--------------------------------------
[1] We do know, per Bloomberg, that the trade was reported via FINRA’s ADF, which means that the execution did not occur on an exchange. So, it could have occurred in a dark pool or other Alternative Trading System (ATS) venue, but more likely it was done through an institutional broker.