Showing posts with label Sovereigns. Show all posts

Tuesday, February 20, 2018

Apple or the United States: Which is the Stronger Credit?

In blogs like this, we sometimes like to begin discussions. 

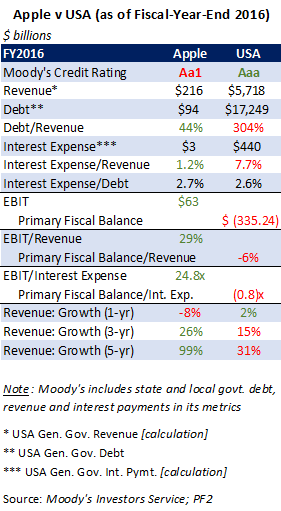
Today, we're going to present an interesting situation. Moody's holds that the US is a Aaa credit, while Apple Inc. is rated Aa1 (both its debt and its corporate family ratings are Aa1). 

Aside from some recent hiccups, Apple is a growing company (see the chart). Its debt level sits at 44% of its annual revenues, and the expense of its debt is somewhat moderate, at 1.2% of its annual revenues. The US is growing its revenues too, albeit at a modest clip. The expense of its debt, however, is approaching 8% of annual revenues. 

Recent developments make us wonder whether the US is truly the stronger credit. This blog takes you through some of the bigger picture here, including elements of the credit rating processes that might be supportive of the rating agency's stance, despite the numbers perhaps telling a different story. We don't take a position here, as much as pose the question.  And we look forward to your thoughts.

Comparing Apples & Oranges? 

Recent fiscal developments have us thinking again about the US's credit rating.

February 9th’s budget and spending caps agreement tipped next year’s budget deficit over $1 trillion, according to the Committee for a Responsible Federal Budget, despite the fact that we are almost nine years into the current economic expansion and with the official (U3) unemployment rate at just 4.1%.  That bipartisan debt binge, in the wake of last year’s $1.5 trillion tax cut (over ten years), has some prudent budget-watchers scratching their heads. 

Last month, Reuters reported that “China’s Dagong Global Credit Rating Co, one of the country’s most prominent ratings firms, on Tuesday cut the local and foreign currency sovereign ratings of the United States, citing an increasing reliance on debt in the world’s largest economy.” Dagong cut the US’s sovereign rating to BBB+ (from A-), with a negative outlook. 
“Deficiencies in the current U.S. political ecology make it difficult for the efficient administration of the federal government, so the national economic development derails from the right track,” Dagong said. “Massive tax cuts directly reduce the federal government’s sources of debt repayment, therefore further weakens the base of government’s debt repayment.”
Looking at the numbers as of fiscal year-end 2016 (the most recent year with complete figures), Apple’s debt as a percentage of revenue and its interest expense as a percentage of revenue are much lower than the US’s corresponding levels.

Strictly based on the debt/revenue and interest expense/revenue ratios, an entity with US’s metrics would likely garner a below-investment-grade rating: according to Moody’s' ratings methodology for diversified technology companies, a negative EBIT/Interest Expense equates to a rating of Ca (the lowest rating on the subfactor scale), all else equal.

US’s Primary Balance/Interest Expense, our proxy for US’s EBIT/Interest Expense, is negative. We don’t have a proxy for the US’s EBITDA (earnings before interest, taxes, depreciation, and amortization), but let’s take our proxy for the US's EBIT and magically add back $2 trillion(!) worth of imaginary “depreciation and amortization.” Doing so gets us to an “EBITDA” of $1.7 trillion. In this hypothetical, its Debt/EBITDA is still over 10x, which would correspond to a rating of Ca (all else equal) for a diversified technology company.

Even in the rosiest possible proxy for EBITDA, in which we suppose USA has zero expenditures(!), and thus its EBITDA would simply equal its revenue, the hypothetical Debt/EBITDA would be 3x, which maps to a rating of Ba, all else equal, for a diversified technology company.

Viewing the US’s long-term fiscal situation with a more critical lens, we might consider the future fiscal impact of Social Security and Medicare – which are underfunded by $46.7 trillion over the next 75 years (per the Fiscal Year 2016 Financial Report of the U.S. Government jointly produced by the US Treasury and the Office of Management and Budget of the Executive Office of the President). 

Yet, Moody’s and many of the other rating agencies don't seem overly concerned, rating the US Aaa (stable outlook).

Into the finer details, now, there are several quantitative factors that might be equally or more relevant to these entities’ respective ratings (e.g. EBITDA margin or FCF/Debt for Apple; Interest Expense/GDP or Inflation for the US), but we tried to highlight metrics in this chart which are most comparable between the two debt issuers. 

Keep in mind that there are also key qualitative characteristics that Moody’s considers when rating corporates and sovereigns. For example, Moody’s gives significant weight to considerations such as management financial policy (“management and board tolerance for financial risk”) for diversified technology corporations, and institutional strength (specifically, “government effectiveness”, “rule of law”, and “control of corruption”) for sovereigns.  

Notably: 
  • The United States government has the legal authority to compel its “customers” (i.e. taxpayers) to pay more, if necessary (although political willingness might be another matter), while a corporation has no such relationship with its customers.
  • Apple lacks a printing press, whereas the USA can print its own currency. 
  • The US has a central bank that has the ability to monetize federal debt, whereby the Federal Reserve can essentially finance fiscal deficits by purchasing as much government debt as the federal government issues, although technically the Fed maintains its independence from political interference. 
  • (Moody’s does consider inflation as an important ingredient in its sovereign ratings, so the rating itself might suffer in a scenario in which the country printed its way of a fiscal hole, but there technically would still be no default.)
Altogether, Apple’s revenue is growing faster than the US’s (99% vs. 31%, over 5 years), it has much less debt than the US (relative to revenue: 44% vs. 304%), and its interest expense is much lower (relative to revenue: 1.2% vs. 7.7%).

So the question is, are the US’s other strengths or advantages -- its ability to raise more revenue through taxes if truly needed, and its unique ability to service its debts by either printing more of the world’s reserve currency or having its central bank purchase its debt -- enough to justify a Aaa rating?  In deciding this, one must consider not only the US's current trillion dollar deficits at a point in the economic cycle that does not beg for drastic fiscal stimulus, but also the fact that we have a Social Security and Medicare funding gap of nearly $47 trillion, in present value terms, that is only growing worse. (At this juncture, it seems that our elected officials have chosen to do nothing about the funding gap.)

Remember, the question is not whether or not the US will default, or how it may grow itself out of the current situation -- but whether the likelihood of there being an issue here is so remote as to warrant a Aaa rating, a rating higher than that of Apple's debt, which is currently well-supported.

It is worth considering Stein’s Law as we end this blog: "If something cannot go on forever, it will stop" or "Trends that can't continue, won't."  Interestingly, Stein meant this in the sense that there is no need for action or a program to make it stop, much less to make it stop immediately; it will stop of its own accord.

Lisa Benson Editorial Cartoon used with the permission of Lisa Benson, the
Washington Post Writers Group and the Cartoonist Group.  All rights reserved.


Tuesday, February 3, 2015

S&P Settles: Now How About that US Bond Rating?

In its settlement with the Department of Justice, S&P has backed off its assertion that the federal lawsuit was filed in retaliation for its 2011 downgrade of US Treasury debt. But the downgrade subjected S&P to a barrage of criticism both at the time and ever since, raising the question of whether the decision was appropriate. My view is that the downgrade was the correct credit decision in 2011, but that it is now time for S&P to restore the US to AAA status.

Since rating agencies earn minimal revenue from sovereign ratings, the downgrade was clearly not in the firm’s short term commercial interest. This speaks well for the sovereign group and senior management at the time: the analysts looked the numbers, decided that the US was no longer a triple-A credit and were allowed to implement and publicize their decision. While we often hear negative generalizations about rating agencies, it is worth noting that these firms are heavily siloed; the behavior of the structured finance group does not necessarily reflect on the work of the sovereign team.

Not only was the downgrade principled, but it was also justified. In 2011, the US debt-to-GDP ratio was skyrocketing, the country had an unsustainable fiscal outlook and it lacked the political will to deal with the imbalance between future revenues and swelling entitlements arising from baby boomer retirements. While the British and Italian governments were able to address population aging by raising taxes and delaying eligibility for social insurance programs, divided government in the US prevented a grand bargain from occurring here.

Further evidence that the US did not merit a top credit rating emerged in October 2013 when both parties engaged in brinkmanship over raising the debt ceiling. Had the debt ceiling not been raised, the Treasury would been forced to prioritize payments. While I believe that the Treasury would have prioritized debt service over other obligations, my confidence in this belief does not approach the 99.9%+ level normally associated with AAA ratings.

So what has changed and why am I suggesting an upgrade? First, after taking widespread blame for the debt ceiling debacle, Republicans have changed tactics. It is now extremely unlikely that they will trigger a similar confrontation when the debt ceiling has to be raised again. Since failure to raise the debt ceiling and failure to prioritize debt service are both low probability events, the chances of both occurring seem to be within the AAA risk band.

More relevant to S&P’s original downgrade decision, the nation’s fiscal long term outlook has changed since 2011. When I say this, I am not referring to the marked decline in headline deficit numbers. The fact that the annual deficit declined from $1.3 trillion in fiscal 2011 to a projected $468 billion in fiscal 2015 is not a surprise. Looking back at CBO’s ten year projection from 2011, the agency estimated a $551 billion deficit for the current fiscal year – pretty close to what we are actually seeing. While politicians from both parties may be congratulating themselves for this improvement, the downward deficit trend is exactly what one would expect from an improving economy. Rising tax revenues and lower unemployment insurance costs – not any major reform – are reducing the deficit. There was no grand bargain, nor is there likely to be one anytime soon.

But two developments since 2011 have greatly altered the country’s longer term outlook: reduced healthcare cost inflation and persistently lower interest rates. Between 2000 and 2007, annual healthcare expenditure growth averaged 8.5%. Since 2009, the rate of growth has averaged only 3.9% and health expenditures have stopped rising as a percentage of GDP. Back in 2011, the decline in health cost inflation could be dismissed as a temporary effect of the Great Recession – but now that it has persisted into the recovery, we apparently have a lower baseline rate. Since healthcare costs are such a large component of future federal spending, less cost escalation in this sector is a very important factor in the long term fiscal outlook. 

Last year CBO projected that in 2039 the US debt/GDP ratio would reach 106% under current law and 183% under a likely set of alternative policies. As healthcare disinflation persists these forecast levels are likely to fall. 

Lower interest rates should also slow the accumulation of debt. After years of recovery and many months after the end of quantitative easing, Treasury rates remain near record lows. Rather than assume that rates will return to pre-recession levels, it now seems more reasonable to assume that we have entered a new normal of ultra-low rates just as Japan did after 1990.

While discussion around government solvency often revolves around a nation’s debt-to-GDP ratio, a better measure is the ratio of interest expense to revenue – because it focuses on the government’s ability to maintain debt service. Just after World War II, Britain reached a debt-to-GDP ratio of 250% but did not default because it faced very low interest rates. If interest rates remain low in the US, the federal government can comfortably service the 183% debt load envisaged by CBO’s most pessimistic scenario.

In 1991, the nation’s interest/revenue ratio peaked at 18% - but there was no discussion of a default. Currently, the ratio is below 8%. My study of fiscal history suggests that a Western style government becomes vulnerable to default once this ratio reaches 30%. While the US can always avoid a default by printing money, it is possible that an independent Fed Chair would refuse to do so, out of fear that the resulting price inflation would have worse consequences than a Treasury default. 

Under the CBO’s most pessimistic scenario, the interest/revenue ratio reaches 46% in 2039, well into the danger zone. But this outcome assumes an average interest rate on federal debt of 4.85%. Right now this average is below 2% and falling as higher coupon bonds mature and are replaced by new low-rate issues. Even if the government’s average financing rate drifts up to 3%, its interest/revenue ratio will remain below the critical threshold.

S&P had good reason to downgrade the US in 2011. If health cost inflation and interest rates had returned to pre-recession historical norms, the case for the lower rating would still be strong. But now that we have entered a new normal of quiescent healthcare cost escalation and low interest rates, it appears that the US is due for an upgrade.

Monday, March 17, 2014

Government Credit Crisis is Over - So Where are the Ratings Upgrades?

The sovereign and municipal debt crisis of the early 2010s is finished. Overblown predictions of a credit meltdown among European sovereigns, US states and cities, and other advanced economy governments have not been realized. Yes, there have been a few high profile defaults - Greece, Detroit, Harrisburg, Stockton and San Bernardino all come readily to mind because their insolvencies received so much coverage. But many other predicted defaults – Italy, Spain, California, Illinois, San Jose – failed to materialize and the overall default rate among government issuers has been only a few basis points annually. Meredith Whitney’s 2010 forecast of dozens of major municipal defaults is now fully beyond resuscitation – even by Michael Lewis.

Muni bond market shorts set their 2014 hopes on Puerto Rico, but this month’s successful $3.5 billion bond sale makes the odds of a near term default or restructuring remote. Last year, both major pension systems received major overhauls with many current employees taking reduced benefits. Most of Puerto Rico’s debt is long term and annual deficits are relatively low, so the Commonwealth’s intermediate term financing needs are modest. 

The end of the default “wave” and its limited magnitude leave credit rating agencies in an awkward position. Having repeatedly downgraded government credits, their current ratings are inconsistent with those that prevailed at the beginning of the apparent crisis. Also, their government credit ratings are now even more inconsistent with their ratings for corporate and structured – asset classes that have more underlying risk because issuers cannot levy taxes.

In 2013, Fitch announced that it downgraded twice as many US public finance credits as it upgraded in 2013. Moody’s 2013 transition report has yet to appear, but weekly accounts of its upgrades and downgrades at MunicipalBonds.com suggest a similar pattern. This preponderance of downgrades is occurring despite the overall improvement in state and local government finance. Renewed economic growth is yielding more income and sales tax revenue, rising home prices are swelling property tax receipts and a buoyant stock market is shrinking unfunded pension liabilities. But because Moody’s decided to use a lower rate of return assumption for pension fund assets, it has created the perception of increased credit risk, despite the absence of such. The blizzard of downgrades has largely offset the (upgrading) effects associated with the 2010 reconfiguration of the municipal ratings scale that had been undertaken in the wake of a lawsuit by Connecticut’s attorney general.

Meanwhile, the high profile states of California and Illinois remain at single-A despite the marked improvement in their prospects. Since Moody’s last downgraded California, the state has swung from deficit to surplus and seen a substantial decrease in its unemployment rate. Illinois, downgraded in mid-2013 due to a temporary failure to pass pension reform, has yet to see a compensatory upgrade now that the reform has been enacted. My own view was that neither state had material default risk in the medium term, given their low debt service requirements relative to projected revenue.

Markets appear to be rejecting the drumbeat of dire rating actions. In the same week that Puerto Rico successfully sold its non-investment grade issue, Chicago placed $884 million in securities on the heels of two Moody’s downgrades (a three notch reduction from Aa3 to A3 in July 2013 followed by a further one notch cut to Baa1 this month).

Perhaps markets have started to ignore ratings because they have become so rudderless. Ratings have inconsistent meanings because they are products of human discretion. If, instead, they were the outcome of stable, empirically-based algorithms, ratings would more likely have the same meaning across time and between categories. Unlike human analysts, computer models don’t have to worry about criticism that they are being soft on politicians or inadequately mindful of unfunded pension liabilities – which are rarely associated with actual bond defaults anyway.

Finally, it is worth noting that inconsistent, incoherent ratings are not merely a sin of US rating agencies. Dagong, which commanded respect for issuing a sub-AAA rating to the US back in 2010, has not covered itself in glory since. After the end of the October 2013 government shutdown it inexplicably downgraded the US rating to A-.

The Chinese rating agency, apparently unaware that partial shutdowns are a familiar part of the US political scene, suggested that the October incident reflected an unprecedented level of risk. Contrary to political and media hyperbole, there was never a serious risk of a Treasury default arising from either a shutdown or a delay in raising the debt ceiling. While I agree that an issuer that engages in kabuki theatre over its credit obligations cannot warrant a top rating, it is absurd to place the world’s most powerful government a few notches above junk amidst declining deficits and accelerating economic growth. Further, we should all take pause from the fact that the Fed has proven capable of buying the lion’s share of new Treasury issuance with freshly printed money and without triggering price inflation.

Dagong’s goal appears to be to convince the world that the US is a worse credit than China. That’s a hard case to make given the latter’s relatively short history as a market participant, its lack of transparency and the risk that its single party political system cannot be sustained over the long term.

But regardless of the ratings themselves, Dagong’s process is disturbingly similar to that of the Western incumbents – discretionary ratings subject to political pressure and human biases. This is unfortunate for a rating agency that hopes to displace the ruling ratings triumvirate. By declining to offer a superior analytical product, Dagong leaves investors little choice but to stay with the incumbents.

Monday, September 30, 2013

Bill Gross and Moody's US Ratings

Last week, Bill Gross sent a tweet suggesting that investors should not trust Moody’s US sovereign rating. Given my own concerns about biases in sovereign ratings generally and a review of recent Moody’s pronouncements on US debt, I think Gross has a valid point.

On July 18, the agency affirmed America’s Aaa rating and raised its outlook from negative to stable. The timing of Moody’s action looks a bit odd in an environment of budget gridlock and threats of default if Congress fails to raise the debt ceiling. In 2011, US credit downgrades were sometimes justified in terms of political dysfunction. Since ongoing deficits will necessitate further debt ceiling hikes in coming years and we continue to face a Cold War style domestic political environment, future drama is all but inevitable. Stable, triple-A sovereigns are not supposed to be a source of drama.

Back on July 13, 2011, Moody’s placed the US rating on review for downgrade “given the rising possibility that the statutory debt limit will not be raised on a timely basis, leading to a default on US Treasury debt obligations.” We are now in the same situation, yet Moody’s has not initiated any sort of review. Worse, on September 11, 2012, Moody’s wrote the following about its plans for the 2013 debt ceiling debate: “the government's rating would likely be placed under review after the debt limit is reached but several weeks before the exhaustion of the Treasury's resources.” This is where we are now, so what happened to the review?

After the 2011 debt ceiling increase, Moody’s affirmed its Aaa rating but assigned a negative outlook to US sovereign credit. It gave four conditions that could trigger an eventual downgrade, one of which was the failure to adopt further fiscal consolidation measures in 2013. No such measures have been adopted this year, nor are any feasible in the current political climate. We did see a resolution to the fiscal cliff debate back in January, but that was not a fiscal consolidation measure. Had nothing been done in January, all of the Bush era tax cuts would have expired. Instead, these cuts were made permanent for 99% of Americans at an estimated ten year cost of $3.6 trillion.

In its September 11, 2012 update, Moody’s conditioned the country’s Aaa rating on the adoption of “specific policies that produce a stabilization and then downward trend in the ratio of federal debt to GDP over the medium term.” In lay terms, Moody’s was asking for a grand bargain which would address taxes and entitlement reform. But, as we all know, there has been no grand bargain nor is it reasonable to expect one until 2015 at the earliest.

Based on Moody’s 2011 and 2012 pronouncements, it is hard to justify the agency’s July 2013 action. Moody’s rationalized it on the grounds that “the US government's debt-to-GDP ratio through 2018 will demonstrate a more pronounced decline than Moody's had anticipated when it assigned the negative outlook”. 

Since Moody’s appears to rely on CBO numbers, it is worth checking this contention against changes in the CBO budget baseline. In August 2011, CBO’s baseline budget projection called for a 65.2% debt to GDP ratio in 2018. The latest CBO forecast estimates a 68.4% ratio in 2018. So things actually look worse in 2018 than originally anticipated, yet Moody’s reaction is an upgraded credit outlook.

So we now see the basis for Bill Gross’ tweet. Moody’s pronouncements on US debt are inconsistent and thus not useful to the investment community. Changes in the rating stance do not appear to have a basis in policy; instead they seem to portray a reluctance to offend the federal government. 

From the perspective of Moody’s shareholders, however, this may be a wise approach: given S&P’s claim that the federal lawsuit it faces was payback for its having downgraded the US debt, Moody’s shareholders may (rightly or wrongly) be fearful that their stock would lose value should Moody’s downgrade the US. Bill Gross may be saying that the presence of such a conflict can undermine any hopes for independence or integrity in the ratings process.

Tuesday, September 17, 2013

Crystal-Clear Country Ratings

If you're one for ratings transparency, you'll be somewhat enthusiastic about Moody's changes to their methodology for rating sovereign debt.

Moody's previous methodology was more of a framework -- there were no "numbers" for the mathematicians among us.
Aa credits had – "Very high economic, institutional or government financial strength and no material medium-term repayment concern."
A credits exhibited – "High economic, financial or institutional strength and no material medium-term repayment concern."
The new methodology provides significant mathematical guidance for those looking to independently verify what a country's rating ought to be, either to prepare for an upgrade or downgrade, or to begin the ratings process for an unrated sovereignty.

It looks like Moody's has taken the stance that their ratings process should be somewhat visible, or "reversible."  The language, too, has changed from their methodology of 2008 to their September 2013 release.

The old methodology held that (emphasis added): 
"There is no adequate model for capturing the complex web of factors that lead a government to default on its debt. Rating sovereign entities involves an unusual combination of quantitative and qualitative factors whose interaction is often difficult to predict." ... "a mechanistic approach based on quantitative factors will be unable to capture the complexity of the interaction between political, economic, financial and social factors that define the degree of danger, for creditors, of a sovereign credit. ... This [ratings methodology's] step by step approach produces a narrow rating range. In some instances, however, the final rating may diverge from the range – in other words, the unusual characteristics of a sovereign credit may not be fully captured by the approach.
Moody's new methodology offers to provide more than a road-map (emphasis added):
"The aim of this methodology is to enable issuers, investors and other interested market participants to understand how Moody’s assesses credit risk in this sector, and explain how key quantitative and qualitative risk factors map to specific rating outcomes. Our objective is for users to be able to estimate the likely credit rating for a sovereign within a three notch alpha-numeric rating range in most cases."
Importantly, the new methodology affords Moody's analysts some (possibly substantial) flexibility when applying its model, in the form of what they call in-model "adjustment factors."  If properly applied, the adjustment factors can allow analysts room to maneuver to the extent the pure mathematical model alone isn't capturing the risk they're identifying. (As an aside, we would recommend investors push for adjustment factors to be disclosed, so that they cannot be arbitrarily influenced to suit an analyst's opinion: if they can be changed to produce a pre-defined rating expectation, it becomes questionable what the point is of having the model!)

The implementation of the adjustment factors is, unfortunately, not well-defined in any sense.  If, how and when they will be enforced is somewhat unclear -- and the magnitude of their impact is only partially developed, with the implementation and effect of the "diversification" adjustment factor being especially vague:
"This ‘credit boom’ adjustment factor can only lower the overall assessment of the sovereign’s Economic Strength. For most countries, the ‘credit boom’ risk will be Very Low or Low; in these cases, the ‘credit boom’ adjustment factor will be neutral for the assessment of Economic Strength. However, when the combination of the probability of excessive credit growth and its severity lead to a Medium, High or Very High score, this can result in the assessment of Economic Strength being lowered by between one and six scores in the 15-notch Factor 1 score (which translates into a lowering by up to two rating notches). Additional adjustment factors may be considered in the assessment of Economic Strength if deemed appropriate.

Second, the ‘diversification’ adjustment factor allows for the shock absorption capacities afforded by a developed country’s degree of economic diversification and flexibility to lift its overall assessment by one score. We determine the potential for such an adjustment based on the distribution of different sectors’ gross value added in the economy’s annual output. The ‘diversification’ adjustment factor can also lower the overall assessment of a sovereign’s Economic Strength, if, for example, a country is significantly reliant on a single industry or commodity.

Additional adjustment factors may be considered in our assessment of Economic Strength over time if we find that another indicator can provide a universally high degree of explanatory value for Economic Strength." (emphasis added)
While the new methodology doesn't look likely to meet its objective of allowing a market participant to predict a rating "within a three notch alpha-numeric rating range," it must be considered a step in the right direction, at least for those seeking ratings transparency.

------------------------------------------------------------

Reference Documents (may require Moody's log-in):

2013 Methodology
Associated Document -- Refinements to the Sovereign Bond Rating Methodology
2008 Methodology

Monday, December 31, 2012

A New Free Sovereign Risk Database

Happy New Year Readers!

Today we are introducing a free, public database of historical sovereign risk data. It is available at http://www.publicsectorcredit.org/sovdef.

The database contains central government revenue, expenditure, public debt and interest costs from the 19th century through 2011 – along with crisis indicators taken from Reinhart and Rogoff’s public database.


Why This Database?

Prior to the appearance of This Time is Different, discussions of sovereign credit more often revolved around political and trade-related factors. Reinhart and Rogoff have more appropriately focused the discussion on debt sustainability. As with individual and corporate debt, government debt becomes more risky as a government’s debt burden increases. While intuitively obvious, this truth too often gets lost among the multitude of criteria listed by rating agencies and within the politically charged fiscal policy debate.

In addition to emphasizing the importance of debt sustainability, Reinhart and Rogoff showed the virtues of considering a longer history of sovereign debt crises. As they state in their preface:
“Above all, our emphasis is on looking at long spans of history to catch sight of ’rare’ events that are all too often forgotten, although they turn out to be far more common and similar than people seem to think. Indeed, analysts, policy makers, and even academic economists have an unfortunate tendency to view recent experience through the narrow window opened by standard data sets, typically based on a narrow range of experience in terms of countries and time periods. A large fraction of the academic and policy literature on debt and default draws conclusions on data collected since 1980, in no small part because such data are the most readily accessible. This approach would be fine except for the fact that financial crises have much longer cycles, and a data set that covers twenty-five years simply cannot give one an adequate perspective…”
Reinhart and Rogoff greatly advanced what had been an innumerate conversation about public debt, by compiling, analyzing and promulgating a database containing a long time series of sovereign data. Their metric for analyzing debt sustainability – the ratio of general government debt to GDP – has now become a central focus of analysis.


We see this as a mixed blessing. While the general government debt to GDP ratio properly relates sovereign debt to the ability of the underlying economy to support it, the metric has three important limitations.

First, the use of a general government indicator can be misleading. General government debt refers to the aggregate borrowing of the sovereign and the country’s state, provincial and local governments. If a highly indebted local government – like Jefferson County, Alabama – can default without being bailed out by the central government, it is hard to see why that local issuer’s debt should be included in the numerator of a sovereign risk metric. A counter to this argument is that the United States is almost unique in that it doesn’t guarantee sub-sovereign debts. But, clearly neither the rating agencies nor the market believe that these guarantees are ironclad: otherwise all sub-sovereign debt would carry the sovereign rating and there would be no spread between sovereign and sub-sovereign bonds - other than perhaps a small differential to accommodate liquidity concerns and transaction costs.

Second, governments vary in their ability to harvest tax revenue from their economic base. For example, the Greek and US governments are less capable of realizing revenue from a given amount of economic activity than a Scandinavian sovereign. Widespread tax evasion (as in Greece) or political barriers to tax increases (as in the US) can limit a government’s ability to raise revenue. Thus, government revenue may be a better metric than GDP for gauging a sovereign’s ability to service its debt.

Finally, the stock of debt is not the best measure of its burden. Countries that face comparatively low interest rates can sustain higher levels of debt. The United Kingdom avoided default despite a debt/GDP ratio of roughly 250% at the end of World War II. The amount of interest a sovereign must pay on its debt each year may thus be a better indicator of debt burden.

Our new database attempts to address these concerns by layering central government revenue, expenditure and interest data on top of the statistics Reinhart and Rogoff previously published.

A Public Resource Requiring Public Input

Unlike many financial data sets, this compilation is being offered free of charge and without a registration requirement. It is offered in the hope that it, too, will advance our understanding of sovereign credit risk.

The database contains a large number of data points and we have made efforts to quality control the information. That said, there are substantial gaps, inconsistencies and inaccuracies in the data we are publishing.

Our goal in releasing the database is to encourage a mass collaboration process directed at enhancing the data. Just as Wikipedia articles asymptotically approach perfection through participation by the crowd, we hope that this database can be cleansed by its user community. There are tens of thousands of economists, historians, fiscal researchers and concerned citizens around the world that are capable of improving this data, and we hope that they will find us.  To encourage participation, we have supplied a comments feature and plan to add more participatory functionality in late January.

Sources and Acknowledgements

Aside from the data set provided by Reinhart and Rogoff, we also relied heavily upon the Center for Financial Stability’s Historical Financial Statistics. The goal of HFS is “to be a source of comprehensive, authoritative, easy-to-use macroeconomic data stretching back several centuries.” This ambitious effort includes data on exchange rates, prices, interest rates, national income accounts and population in addition to government finance statistics. Kurt Schuler, the project leader for HFS, generously offered numerous suggestions about data sources as well as connections to other researchers who gave us advice.

Other key international data sources used in compiling the database were:

  • International Monetary Fund’s Government Finance Statistics
  • Eurostat
  • UN Statistical Yearbook
  • League of Nation’s Statistical Yearbook
  • B. R. Mitchell’s International Historical Statistics, Various Editions, London: Palgrave Macmillan.
  • Almanach de Gotha
  • The Statesman’s Year Book
  • Corporation of Foreign Bondholders Annual Reports
  • Statistical Abstract for the Principal and Other Foreign Countries

For several countries, we were able to obtain nation-specific time series from finance ministry or national statistical service websites.

We would also like to thank Dr. John Gerring of Boston University and Co-Director of the CLIO World Tables project, for sharing data and providing further leads as well as Dr. Joshua Greene, author of Public Finance: An International Perspective, for alerting us to the IMF Library in Washington, DC.

A number of researchers and developers played valuable roles in compiling the data and placing it on line. We would especially like to thank Charles Tian, T. Wayne Pugh, Amir Muhammed and Anshul Gupta, as well as Karthick Palaniappan and his colleagues at H-Garb Informatix in Chennai, India for their contributions.

Finally, we would like to thank the National University of Singapore’s Risk Management Institute for the generous grant that made this work possible.

Thursday, December 13, 2012

The Real Fiscal Cliff

Recent developments in the fiscal cliff negotiations should put to rest any hope that this process will produce a meaningful solution to the nation’s long term fiscal imbalance. For advocates of fiscal sustainability, the negotiation suffers from two serious flaws:

(1)    The fact that the party leaders are still playing to their respective bases, rather than having serious, closed door discussions. Since real long term reform would be very complex and politically painful, it requires time to run the numbers and build support for the sacrifices required on both sides. If these activities are telescoped into the last two weeks of December, they cannot be accomplished effectively. What we are likely to see then is a deal lacking in specifics with numbers that don’t add up.

(2)    Attention is mostly focused on avoiding the immediate emergency posed by the fiscal cliff and on the top two income tax brackets (the adjustment of which can only generate a small part of the solution). To the extent that attention focuses on the Armageddon that awaits us on 1/1/2013 or the morality of tax rates, less space is available to educate the public about the need to address long term sustainability issues.

To the extent that budget impacts are being considered, the discussion has focused on how to achieve $4 trillion of deficit reduction in the next ten years. The debate typically obscures the question of what “base” the $4 trillion in savings will come from. This base scenario is most certainly not current law – since that would include all the spending reductions and tax increases that compose the fiscal cliff. In fact any fiscal cliff compromise is likely to entail higher ten year aggregate deficits than those that would occur under current law.

Moreover, ten year scoring of budget proposals takes attention away from the most important fact. Under current policies or anything approximating them, the US will probably run deficits of several trillion dollars each year during the late 2020s and early 2030s. This is precisely when the greatest burdens will be placed on Social Security and Medicare because the maximum number of baby boomers will be both alive and retired. Since these big deficits will be piled onto an already large stock of debt, they are likely to trigger some form of sovereign debt crisis. Such a crisis would have devastating effects on taxpayers, government employees, beneficiaries and bondholders – as it would be manifest in some combination of sharp tax increases, deep spending cuts, inflation, and possibly an outright default on Treasury obligations. Some of these effects would probably trigger widespread civil unrest similar to the violence we have been seeing in Greece. Unlike today’s fiscal cliff, which can be avoided through simple legislation, this future crisis would be far steeper and far more difficult to side-step:  revenue and expenditure would be forced to immediately converge due to the unaffordability of deficit financing.

Since I am a financial analyst and not a politician, the preceding narrative contains two serious flaws. I have told you that any crisis is 15 to 20 years away and that it is likely rather than certain. I would better command your attention by claiming that there will be an immediate crisis if nothing is done, but that isn’t credible. Since I am writing for a thoughtful audience, I am confident that you will read on.

Due to the existing low interest rate environment, debt service cannot become an unbearable burden anytime soon. Given the amount of global liquidity and the fact that US debt contains a substantial component of long dated bonds, there is no reasonable scenario under which rising interest rates will trigger a crisis in the near term. To say otherwise might make for a great rhetorical flourish on a talk show, but it just has no economic or mathematical basis.

In the longer term, a crisis is only likely rather than certain for a number of reasons. In general, it is fair to say that any long term prediction has to be qualified just because of the sheer weight of accumulated uncertainties. In this specific case, it is possible that we will be saved by some new innovation that sharply increases productivity thereby generating enough incremental revenue to get us over the hump. Another possibility is that interest rates won’t revert to post-World War II historical averages. Perhaps we have entered a new normal in which massive global savings will continue to compete for an insufficient supply of fixed income investments, or one in which large portions of the federal debt can be monetized without price inflation (due to declining monetary velocity).

On the other hand, there are also extreme scenarios that could exacerbate any future fiscal crisis. A medical breakthrough that significantly extends life spans under the current fixed retirement age system would greatly increase dependency ratios. A major war or series of large natural disasters could sharply increase deficits at any time.

Putting all these tail scenarios aside and focusing on outcomes nearer the median, the fact remains that population aging will probably cause a long term fiscal crisis in the absence of major reform. Failure to plan for this eventuality seems to me to be the height of irresponsibility.

Given the size of America’s fiscal gap and the division of power, the only politically feasible plan is one that increases revenues and reduces spending growth in multiple areas, including discretionary spending, Social Security and health care entitlements. Unless the plan distributes the pain across all areas, it will probably be either too small or unable to become law.

If voters demand government services that roughly approximate those now available, it will not be possible to hold spending to 18% of GDP – a limit suggested by Republican leaders in the 111th Congress. As more and more people draw Social Security and use Medicare services, spending will rise sharply, even if these entitlements are adjusted somewhat. Simply taxing the rich won’t be sufficient to fill the fiscal gap. Higher income taxes at all levels and/or new consumption taxes will be required. As a libertarian, I personally oppose taxes and believe that it would be both morally preferable and economically more efficient to cut spending enough to achieve a primary budget balance without increasing revenues.  But since my party received 1% of the vote in the Presidential election, this plan will not be enacted. Instead, we will either have a plan that includes considerable, broad-based tax increases or one that doesn’t solve the problem.

Prevailing wisdom suggests that domestic, non-discretionary spending programs are individually too small and have too much political support to contribute much to closing the fiscal gap. Cutting them across the board may have adverse unintended negative consequences.  Earlier decades have bequeathed us two ideas that can be used to achieve significant savings in these programs. Zero based budgeting, properly understood, involves a complete reappraisal of all spending items. It is designed to address the question of whether each program remains cost effective or is just continuing due to inertia. Because Congress is too politically conflicted to successfully implement zero based budgeting, it should delegate this responsibility to a bi-partisan commission as it did when base closings were required at the end of the Cold War. A politically neutral zero based budgeting commission could wring substantial savings out of domestic discretionary spending without disrupting truly valued services.

Advocates of military spending often remind us that defense is not a driver of the impending problem because it represents a stable or declining share of GDP – depending upon the base year used. However, if that base year was during the Cold War, the comparison isn’t meaningful. The country no longer needs to stare down the Soviet Union and its network of clients. Rather than exaggerate the threats posed by China, North Korea, Iran and al Qaeda, defense advocates should be supporting the elimination of Cold War oriented weapons programs that are not designed for today’s lesser security issues. Also, since the US represents a far diminished share of world GDP, its relative responsibility for funding alliances like NATO needs to be reconsidered. While it is true that entitlement spending will be the driver of future budget imbalances, there is no reason that offsetting savings cannot be found elsewhere in the budget. A dollar spent on defense has the same budgetary impact as a dollar spent on Medicare. The budget can and should shift away from defense and toward entitlements.

Social security proponents take a similar tack to the defense hawks: “our favorite program is not really the problem so let’s look elsewhere for savings.” Often the argument revolves around the fact that the Social Security trust fund is not expected to be drained for a couple of decades. But since the trust fund is simply money that the government owes to itself, it is not fiscally significant. More important is the annual gap between social security tax revenues and benefits. Until recently, this difference was positive, now it is near zero and by 2030, it will be negative to the tune of half a trillion dollars annually. While incremental reforms cannot eliminate this annual social security deficit, they can reduce it to the extent that added revenue and other budgetary savings can offset it. The most obvious reforms include making the retirement age a factor of life expectancy – as Italy has recently done – and making downward adjustments to benefit formulae.

While everyone agrees that Medicare is a huge budget problem, the solutions offered often fail to miss the fundamental issue this system poses – an issue that also applies in part to Medicaid and future Affordable Care Act benefits. The US health care system is unique in that it largely fails to use either of the two proven methods known to control costs. In a totally free market system under which patients are fully responsible for their own medical bills or insurance, cost growth is limited by the fact that many people will be unwilling or unable to pay for certain medical services. Since this results in richer people getting better care – an outcome that most people find offensive – all advanced countries have some form of government-sponsored third party payment. However, most countries that have government controlled health systems use non-price rationing to control costs. These rationing tools include waiting lists and “death panels” that deny certain types of care. A meaningful solution to Medicare and other health entitlements is going to require some form of rationing – either through greater patient responsibility as advocated in the Ryan budget or through a strengthened version of the Independent Payment Advisory Board (IPAB) included in the Affordable Care Act. A compromise approach might involve some sort of bimodal system in which beneficiaries could choose between a government -managed HMO (akin to the public option discussed during the health reform debate) and a market based option under which patients receive limited premium support.

Reforms of the type discussed here cannot be formulated and sold to the American people during a couple of weeks in the holiday season. They need to be well designed in order to limit adverse unintended consequences and carefully balanced to ensure that enough House and Senate votes can be cobbled together from those closest to the political center. In the absence of evidence that these planning processes are occurring, I am left with the assumption that any end of year package won’t avert the long term fiscal crisis we now face.

Tuesday, November 27, 2012

Not for Profit Sovereign Ratings Become a Reality

Last week, the Bertelsmann Foundation issued ratings and supporting research for five sovereign bond issuers – Brazil, France, Germany, Italy and Japan. The individual country reports, a summary and a description of the rating methodology are available at http://www.bfna.org/.

The publication of these reports marks a substantial milestone. The Foundation has delivered on the ideas outlined in its April 2012 blueprint for an International Non-Profit Credit Rating Agency (INCRA). It has shown that a not-for-profit organization can produce quality sovereign credit research competitive with that offered by incumbent rating agencies. Further, unlike commercial players, this not-for-profit agency consistently implements a transparent rating methodology.

Last week’s reports show that the Bertelsmann Foundation can produce very detailed research. This should not come as a surprise, since the Foundation has experience in producing comprehensive research in support of its Sustainable Governance Indicators and Bertelsmann Transformation Index. Many think tanks and academic research groups produce reports that compare multiple governments and other institutions. The data collection and interpretation processes used by these non-profits are analogous to those required to rate sovereign governments.

The consistency and transparency of the reports is also noteworthy. The Foundation scores each country according to several dozen macroeconomic and forward looking indicators. The score for each indicator is reported, a published algorithm is used to aggregate the scores and the composite score is converted to a letter grade via a standard mapping.

It is not clear whether the Bertelsmann Foundation plans to issue more sovereign rating research. Comments from organizational leaders suggest that this set of reports constitute a pilot and further steps would have to be taken by a new organization – ideally one supported by an endowment to the tune of $400 million. The endowment would enable the rating organization to operate free of the need to generate income and the temptations for bias such a need entails.

My own view is that biases can be addressed through transparency. If others can look under the kimono, assumptions and procedures that introduce bias can be flagged - placing pressure on the rating issuer to correct them. Since $400 million is not likely to be found in the NGO world, there has been some discussion of securing INCRA funding from the G-20. But a group of sovereigns funding a sovereign rating process could be an invitation to bias.

Thursday, October 18, 2012

Canadian Provincial Debt

Marc's recent research on the financial strength of the Canadian provinces was (finally) published yesterday and is getting some good attention today. 

If interested, have a look at the Wall Street Journal's coverage here.

- PF2

Monday, September 24, 2012

Bringing Academic Rigor to Government Bond Ratings

Since peaking in July, yields on Italian and Spanish long-term bonds have dropped by about 150 basis points. While the headlines attribute this sharp adjustment to the availability of a new ECB bond buying program, neither country has expressed an intention to use it, so perhaps the headline writers are missing something. Looking back, our July 23rd research note concluded that the spread between Italian and German bond yields was excessive given the low probability of an Italian sovereign default.

A Problem of Information

Market volatility is compounded when market participants lack the information necessary to appropriately value investment securities. When rumors and announcements penetrate the information vacuum, investors often overreact. If this vacuum is instead filled with high-quality information and analysis, volatility and mispricing diminish.

Equity market investors can obtain research and analysis from numerous banks and brokerage firms. While much of this research suffers from conflicts of interest, it also contains large volumes of fact and analysis that investors find useful.

For government bonds, the traditional source of analysis has been the major credit rating agencies. Unfortunately, these firms have faced widespread criticism in recent years, leaving their reputations in tatters and their guidance in doubt. Although the highest profile failures have been in structured finance, critics have also questioned whether incumbent rating agencies have sufficient staffing and resources, adequate procedures, and the intellectual capability to meaningfully gauge sovereign default risk.

Potential Ways Forward – A Call to Academics

A number of parties have recommended alternatives to the incumbent rating agencies, including at least four not-for-profit initiatives offering sovereign ratings.

To have a beneficial impact, a non-profit rating agency will have to gain credibility with investors. After all, if ratings don’t guide investment decisions, what value do they have? A not-for-profit credit rating agency can gain credibility by having a strong methodology and solid institutional support. Both of these factors can be advanced by the academic community. Economists, political scientists, statisticians and financial engineers associated with a major university could generate the kind of quality, branded sovereign research that would command the attention of investors.

In hopes of focusing more academic attention on government credit risk, I have contributed an article to the new issue of Economics Journal Watch – a peer-reviewed economics journal freely available online. The article describes problems with the rating agency model, surveys some of the previous literature on government default probability modeling, and offers a research agenda as well as one possible solution.

Academics can deliver the intellectual rigor missing from both status quo rating analysis and some of the alternatives we have been seeing. The thorough data collection procedures, advanced modeling techniques, and peer review practices employed by social scientists can raise the level of sovereign risk analysis.

Monday, July 23, 2012

Marc Joffe Discusses Pros of Open Source Rating Models for Sovereigns / Munis

On Friday night, PF2 consultant Marc Joffe was profiled on The Lang and O’Leary Exchange, a popular Canadian business program.


http://www.cbc.ca/player/News/Business/ID/2258963934/

Wednesday, May 2, 2012

PF2 Launches Open-Source Sovereign and Muni Rating Tool

Hi everyone

For those of you who have been following our last few posts, you'll be happy to know that we've launched PSCF today.

In conjunction with the launch, we're making available sample models for the United States and California.

We've included a set of slides to help you get through this. There's also a white paper taking you through the construction and describing our approach. It's open-source, so feel free to have a bash.

Click around at http://www.publicsectorcredit.org/pscf.html and share your thoughts.

 ~ PF2

PSCF - Press Release

Wednesday, April 25, 2012

Substandard and Porous? A Belated Response to Nate Silver

After S&P downgraded the US last August, Nate Silver analyzed the agency’s record on sovereign debt and found it wanting (See Why S&P’s Ratings Are Substandard and Porous). Silver ran a number of statistical tests, and determined that S&P’s ratings were serially correlated, highly related to the Corruption Perceptions Index and less predictive of default than simple quantitative measures.

Silver’s analysis is impressive for an industry outsider, but it suffered some deficiencies. For example, he applied a linear scale (AAA = 9, AA = 8, A = 7, etc.) when mapping ratings to decimal values. Given the structure of historic default rates, some sort of geometric scaling would have been more appropriate.

Our criticism, however, should not compromise Silver’s core point: that statistical analysis can probably do a better job of telling us about sovereign default probabilities than the traditional rating agency approach.

An Argument for a Model-Based Approach

Certainly, an intensive statistical analysis avoids several of the pitfalls facing sovereign ratings, as currently implemented.

First, a rating methodology that relies heavily on qualitative techniques is vulnerable to bias. The serial correlation Silver found stems from a natural bias at rating agencies against extreme actions. Rather than imposing a large-scale, multiple-notch downgrade, rating committees may be predisposed to implementing a lesser, often single-notch change in the hope that subsequent events will obviate further action. While the biased rater might thus apply a rating inconsistent with the methodology, a computer model, lacking the capacity to “hope,” reverts directly to the honest, brutal truth.

There’s also a more fundamental objection to the rating agency model. Their qualitative approach, requiring the human touch, is labor intensive. But for-profit rating agencies are oddly notorious for understaffing their sovereign rating groups.

A model-based approach enables more frequent, more intensive analysis – as opposed to the infrequent reviews sovereigns now receive. New data can be loaded into the model at regular intervals and new results calculated. Analysts should still oversee the model parameters and check any results that may look suspicious.

The Ingredients of a Sovereign Debt Model

Model-based approaches to sovereign risk often involve credit default swap spreads, as the independent or dependent variable. A model can either extract default probabilities from CDS spreads, or attempt to predict those spreads on the grounds that they are a proxy for actual risk. Silver takes this latter approach in his piece.

The use of market inputs in credit models is fairly common. Such a modeling choice often implicitly or explicitly relies on the Efficient Market Hypothesis – the idea that market prices incorporate all relevant information and are thus the best available estimate of value.

Since the financial crisis, critics of EMH have sharpened their attacks. But whether or not you subscribe to rational expectations, the use of sovereign CDS is hard to defend. Most EMH advocates recognize that only liquid markets are efficient. Since liquid markets have numerous participants, their equilibrium prices incorporate substantial amounts of information.

This is not the case with sovereign CDS markets. Kamakura Corporation examined sovereign trading volumes reported by DTCC for late 2009 and 2010, and found that the vast majority of sovereign CDS contracts were traded fewer than five times per day (excluding inter-dealer trades). Five transactions per day falls well short of a liquid market, and thus the information content of sovereign CDS spreads is doubtful at best.

Absent meaningful CDS spread data, what else can a government credit model rely upon?

While one might look at Corruption Perception Indices, per capita GDP and/or terms of trade, it is not clear that these inputs will differentiate between advanced economy sovereigns and sub-sovereigns. Fortunately, government issuers produce reams of actual and projected fiscal data. This information, combined with demographic inputs and economic forecasts, can take us a long way.

When we suggest that budget forecasts can be employed in government credit modeling, skeptics point out accuracy issues with government forecasters.

The most famous forecasting error is attributed to the US CBO, which predicted trillions of surpluses for the first decade of the 21st century, instead of the trillions in deficits that actually appeared.

CBO forecasts are usually published in the form of point estimates. To be reliable, they have to reflect accurate forecasts of interest rates, GDP, tax levels and a host of other macroeconomic and policy variables. Given the number of variables and our (collective) limited capacity to predict, the point estimate is bound to be wrong. That notwithstanding, we can be pretty certain that these variables will fall within a given range. For example, it is almost certain that US GDP growth will be somewhere between -3% and +6% next year (2013). If we run a large number of scenarios with different GDP growth rates within this range, it is likely that some of the trials will closely approximate the ultimate fiscal outcome.

We can run a large number of budget scenarios by using a Monte Carlo simulation – in which scenarios are created by generating random numbers. Budget simulation forms the basis for PF2’s Public Sector Credit Framework that we will release next week. The tool allows the user to enter a default threshold in the form of a fiscal ratio; create macroeconomic series that vary with each trial through linkages to random numbers; and design fiscal series that rely on one or more of these macroeconomic elements. If you would like to learn more about this technology, please contact us at info@pf2se.com, or call +1 212-797-0215.
------------------------
Contributed by PF2 consultant Marc Joffe. Marc previously researched and co-authored Kroll Bond Rating Agency’s Municipal Default Study. This is the last of four blog posts introducing PF2’s Public Sector Credit Framework. Previous posts on this topic may be found here, here and here.

Wednesday, April 11, 2012

Credit Rating Agency Models and Open Source

When S&P downgraded the US from AAA to AA+, the US Treasury accused the rating agency of making a $2 trillion mathematical error. S&P initially denied this accusation, but adjusted some of its estimates in a subsequent press release. Economist John Taylor defended S&P, contending that its calculations were based on a defensible set of assumptions, and thus could not be categorized as a mistake. S&P’s model, which projected future debt-to-GDP ratios, has not been made public. As a result, it is difficult for outside observers to decide whom to believe: the rater or the rated.

There are at least three ways a model’s results can be wrong: if the model’s code itself doesn’t function as intended; if the known inputs are incorrectly entered, and if the assumptions are misapplied. In cases as important as the evaluation of US sovereign debt, we think rating agencies and the investing public would be better off if the relevant models were publicly available. Some may argue that the inputs to the models are proprietary or that they reflect qualitative assumptions valuable to the ratings agencies – i.e., that they are a “secret sauce.” But, even if rating agencies want to keep their assumptions proprietary, making the models themselves available would decrease the likelihood of rating errors arising from software defects.

Keeping one’s internal processes internal is the traditional way. Manufacturers assume that consumers don’t want to see how the sausages are made. In the internet era, it is now much easier to produce the intellectual equivalent of sausages in public – and, as it happens, many consumers are interested in the production process and even want to get involved. Wikipedia provides an excellent example of the open, collaborative production of intellectual content: articles are edited in public and the results are often subject to dispute. Writers get almost instantaneous peer review and the outcome is often rapid iteration moving toward the truth. In their books, Wikinomics and Macrowikinomics, Dan Tapscott and Anthony Williams suggest that Wikipedia’s mass collaboration style is the wave of the future for many industries – including computer software.

Many rating methodologies, especially in the area of structured finance, rely upon computer software. At the height of the last cycle, tools that implemented rating methodologies such as Moody’s CDOROMTM, were popular with both issuers and investors wondering how agencies might look at a given transaction. While the algorithms used by these programs are often well documented, the computer source code is usually not released into the public domain.

Over the last two decades, the software industry has seen a growing trend toward open source technology, in which all of a system’s underlying program code is made public. The best known example of open source system is Linux, a computer operating system used by most servers on the internet. Other examples of popular open source programs include Mozilla’s Firefox web browser, the WordPress content management system and the MySQL database.

In financial services, the Quantlib project has created a comprehensive open source framework for quantitative finance. The library, which has been available for more than 11 years, includes a wide array of engines for pricing options and other derivatives.

Open source allows users to see how programs work and with the help of developers, fully customize software to meet their specific needs. Open source communities such as those hosted on GitHub and SourceForge, enable users and programmers from all over the world to participate in the process of debugging and enhancing the software.

So how about credit rating methodologies? Open source seems especially appropriate for rating models. Rating agencies realize relatively little revenue from selling rating models; they are more likely to be used to facilitate revenue generation through issuer-paid ratings.

Open source enables a larger community to identify and fix bugs. If rating model source code were in the public domain, investors and issuers would have a greater chance to spot issues. Rating agencies would be prevented from covering up modeling errors by surreptitiously changing their methodologies. In 2008, The Financial Times reported that Moody’s errantly awarded Aaa credit ratings to a number of Constant Proportion Debt Obligations (CPDOs) due to a software glitch. The error was fixed, but the incorrectly rated securities were not immediately downgraded according to the FT report. Had the rating software been open source, it would not have been much more difficult to conceal this error, and it would have offered the possibility for a positive feedback loop – an investor or other interested party could have found and fixed the bug on Moody’s behalf.

Not only do open source rating models promote quality, they may also reduce litigation. The SEC issued Moody’s a Wells Notice in respect of the above mentioned CPDO issue, and may well have brought suit. (A Wells Notice is a notification of intent to recommend that the US government pursue enforcement proceedings, and is sent by regulators to a company or a person.) Investors have brought suit against the rating agencies to the extent they felt the ratings were inappropriate, for model-related errors or otherwise. By unveiling the black box, the rating agencies would be taking an active approach in buffering against litigation, and enjoy the material defense that, “yes we may have erred, but you were afforded the opportunity to catch our error – and didn’t.”

Unlike the CPDO model employed by Moody’s, the S&P US sovereign "model" likely took the form of a simple spreadsheet containing adjusted forecasts from the Congressional Budget Office. In contrast to the structured and corporate sectors, there are relatively few computer models for estimating sovereign and municipal default probabilities. While little modeling software is available for this sector, accurate modeling of government credit can be seen as a public good. Bond investors, policy makers and citizens themselves could all benefit from more systematic analysis of government solvency.

Open source communities are a private response to public goods problems: individuals collaborate to provide tools that might otherwise appear in the realm of licensed software. Thus open source government default models populated with crowd-sourced data maybe the best way to fill an apparent gap in the bond analytics market.

On May 2nd, PF2 will contribute an open source Public Sector Credit Framework, which is aimed at filling this analytical gap, while demonstrating how future rating models can be distributed and improved in an iterative, transparent manner. If you wish to participate in beta testing or learn more about this technology please contact us at info@pf2se.com, or call +1 212-797-0215.

--------------------------------------------
Contributed by PF2 consultant Marc Joffe. Marc previously researched and co-authored Kroll Bond Rating Agency’s Municipal Default Study. This posting is the second in a series of posts leading up to May 2nd. The prior piece can be accessed by clicking here.